Measuring the environmental impact of cloud workloads is technically challenging: In virtualized environments, workloads are isolated from the physical infrastructure, and security requirements complicate the sharing of server-side data with the workloads. With NADIKI, we have developed an observer architecture that bridges this gap — it captures infrastructure metrics, converts them into environmental impact indicators, and delivers them to the workload without revealing sensitive data.

## Excerpt
Measuring the environmental impact of cloud workloads is technically demanding: In virtualized environments, workloads are isolated from the physical infrastructure, and security requirements complicate the transfer of server-side data to the workloads. With NADIKI, we have developed an observer architecture that bridges this gap — it captures infrastructure metrics, converts them into environmental impact indicators, and provides them to the workload without revealing sensitive data.
## Content
Measuring the environmental impact of cloud workloads is challenging. In complex virtualized environments, a virtual machine is isolated from the physical server it runs on — and security requirements make it difficult to share server-side data with customers or the workload. Similarly, the physical server cannot access the building management network. With NADIKI, we have developed an architecture and open-source implementation for an observer system ("Registrar") that bridges this gap: It captures and converts infrastructure metrics into environmental impact indicators and makes them available to customers without disclosing sensitive or proprietary data.
The Observer Architecture
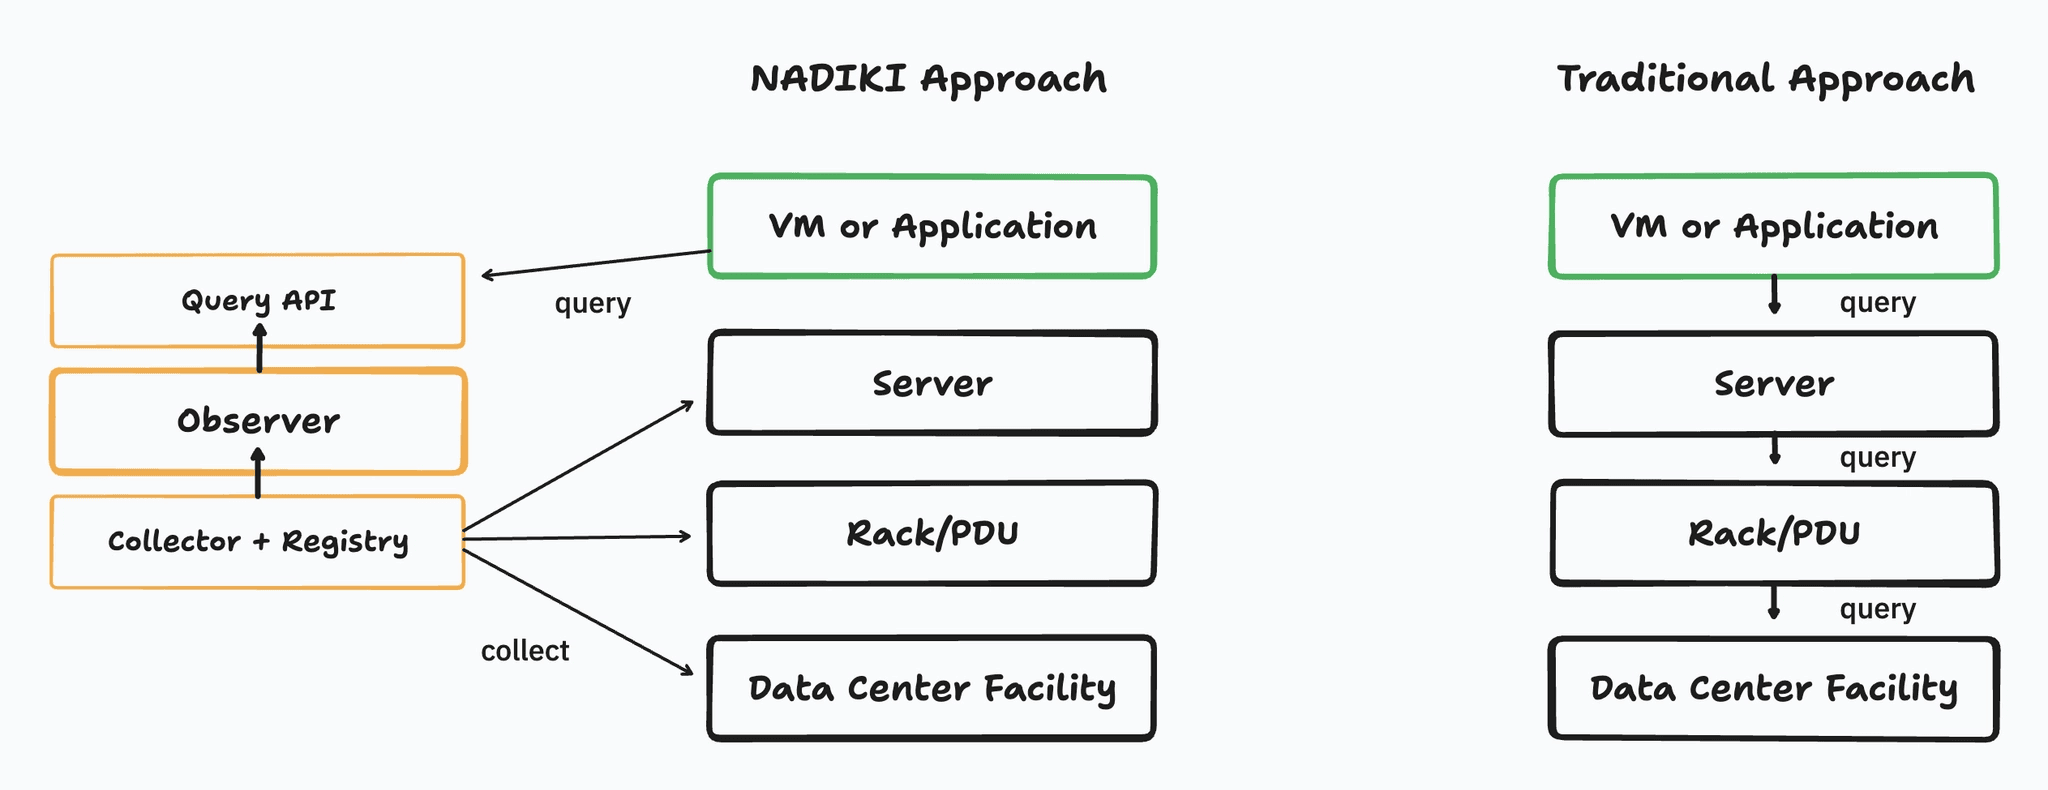
The central innovation is an external system — the Observer — positioned between the physical infrastructure and the customer's workload. It maintains an inventory of all relevant IT assets and building technology assets, receives metrics from these assets, and provides environmental impact data via a clean query interface. In production environments, synchronization with a CMDB or other IT asset management systems is conceivable. Security perimeters remain intact on both sides.
Registrar: Maintains an inventory of all assets — data centers, racks, servers, containers, and applications. Each asset registers itself and receives a unique identifier. The registry informs each asset which metrics should be reported and to which Prometheus-compatible endpoint they should be delivered. It also stores static assumptions and configurations used when real-time measurement data is not available.
Metrics Database: Based on InfluxDB, both push and pull mechanisms are supported. Assets choose which metrics they wish to transmit and by what means — security perimeters are not breached in the process. The database aggregates time-series data from all registered assets. Additionally, using Telegraf, measurement data, if necessary, can be transformed and normalized, e.g., when building management devices transmit data in non-compliant formats.
Query Interface: Workload operators can query the Observer with the unique identification of a workload and a desired time frame for calculated environmental impact information. The Observer calculates which portion of the physical server and infrastructure the workload occupies and completes the full environmental impact attribution — without disclosing business-sensitive information of the infrastructure operators.
The "Observer Pattern" (Wikipedia) is an established software engineering concept: A single observer is notified when its observables — IT assets, racks, data centers — change or record new metrics. In the NADIKI context, this allows for a loose coupling between infrastructure assets and monitoring systems and ensures that environmental impact data is consistently captured without creating tight dependencies between systems.
Environmental Impact Indicators
In compliance with current regulatory requirements such as CSRD and LCA methods, the observer's query interface provides the following environmental impact indicators at the workload level:
Primary Energy Consumption (kWh): Total energy consumption of the workload, including renewable and non-renewable portions.
Reused Energy (kWh): Recovered and reused energy, typically as waste heat.
Water Consumption (m³): Water consumption at the data center level, excluding energy production and manufacturing.
Greenhouse Potential (CO₂-eq.): Grey emissions produced during the manufacturing of infrastructure and servers as well as energy-related emissions.
Abiotic Resource Depletion Potential (kg Sb-eq.): Mineral resource consumption during the manufacturing of servers as well as mechanical and electrical infrastructure in the data center.
Create a System Perspective, Then Optimize
The current state of environmental measurement for cloud workloads heavily relies on estimates. Accurate data on servers, racks, and data centers are rarely accessible to customers — simply because the connection between physical infrastructure and application layer has never been established. NADIKI takes a pragmatic approach to create a system perspective, which we call breakthrough: first connect the tunnel end-to-end, then expand. Existing asset management systems like Netbox or DCIM systems can be extended to feed data into the observer — without needing replacement.
”Rhaetian Railway celebrates breakthrough of Albula tunnel into the Engadin” (Luzerner Zeitung)
All NADIKI specifications and implementations are published as open source. An initial technical implementation of the observer system will follow shortly.
Additional Publications
Research
NADIKI: Real-time measurement of AI energy consumption and CO₂ emissions
Research
Artificial Intelligence
Germany
Research
NADIKI: Why we chose the Observer architecture over a Kubernetes plugin
Research
Digital Sustainability
Germany
Research
NADIKI API: Open interface for environmental impact data from data centers
Research
Artificial Intelligence
Germany