The NADIKI project provides researchers with a JupyterLab environment that offers direct access to real, pseudonymized data from production data centers. Through Jupyter Notebooks, researchers can query and visualize power consumption, CPU utilization, and server properties, and develop their own computational models without needing to build their own infrastructure.
## Excerpt
The NADIKI project provides researchers with a JupyterLab environment offering direct access to real, pseudonymized measurement data from operational data centers. Through Jupyter Notebooks, researchers can query, visualize, and develop their own calculation models for power consumption, CPU usage, and server properties—without needing to build their own infrastructure.
## Content
Research into the energy efficiency and environmental impact of data centers often fails due to a fundamental issue: access to real data. Operators rarely release measurement data due to confidentiality, and publicly available datasets hardly reflect the complexity of real operational systems. With the NADIKI project, we are bridging this gap—via a JupyterLab environment that provides researchers with direct access to pseudonymized measurement data from four pilot data centers.
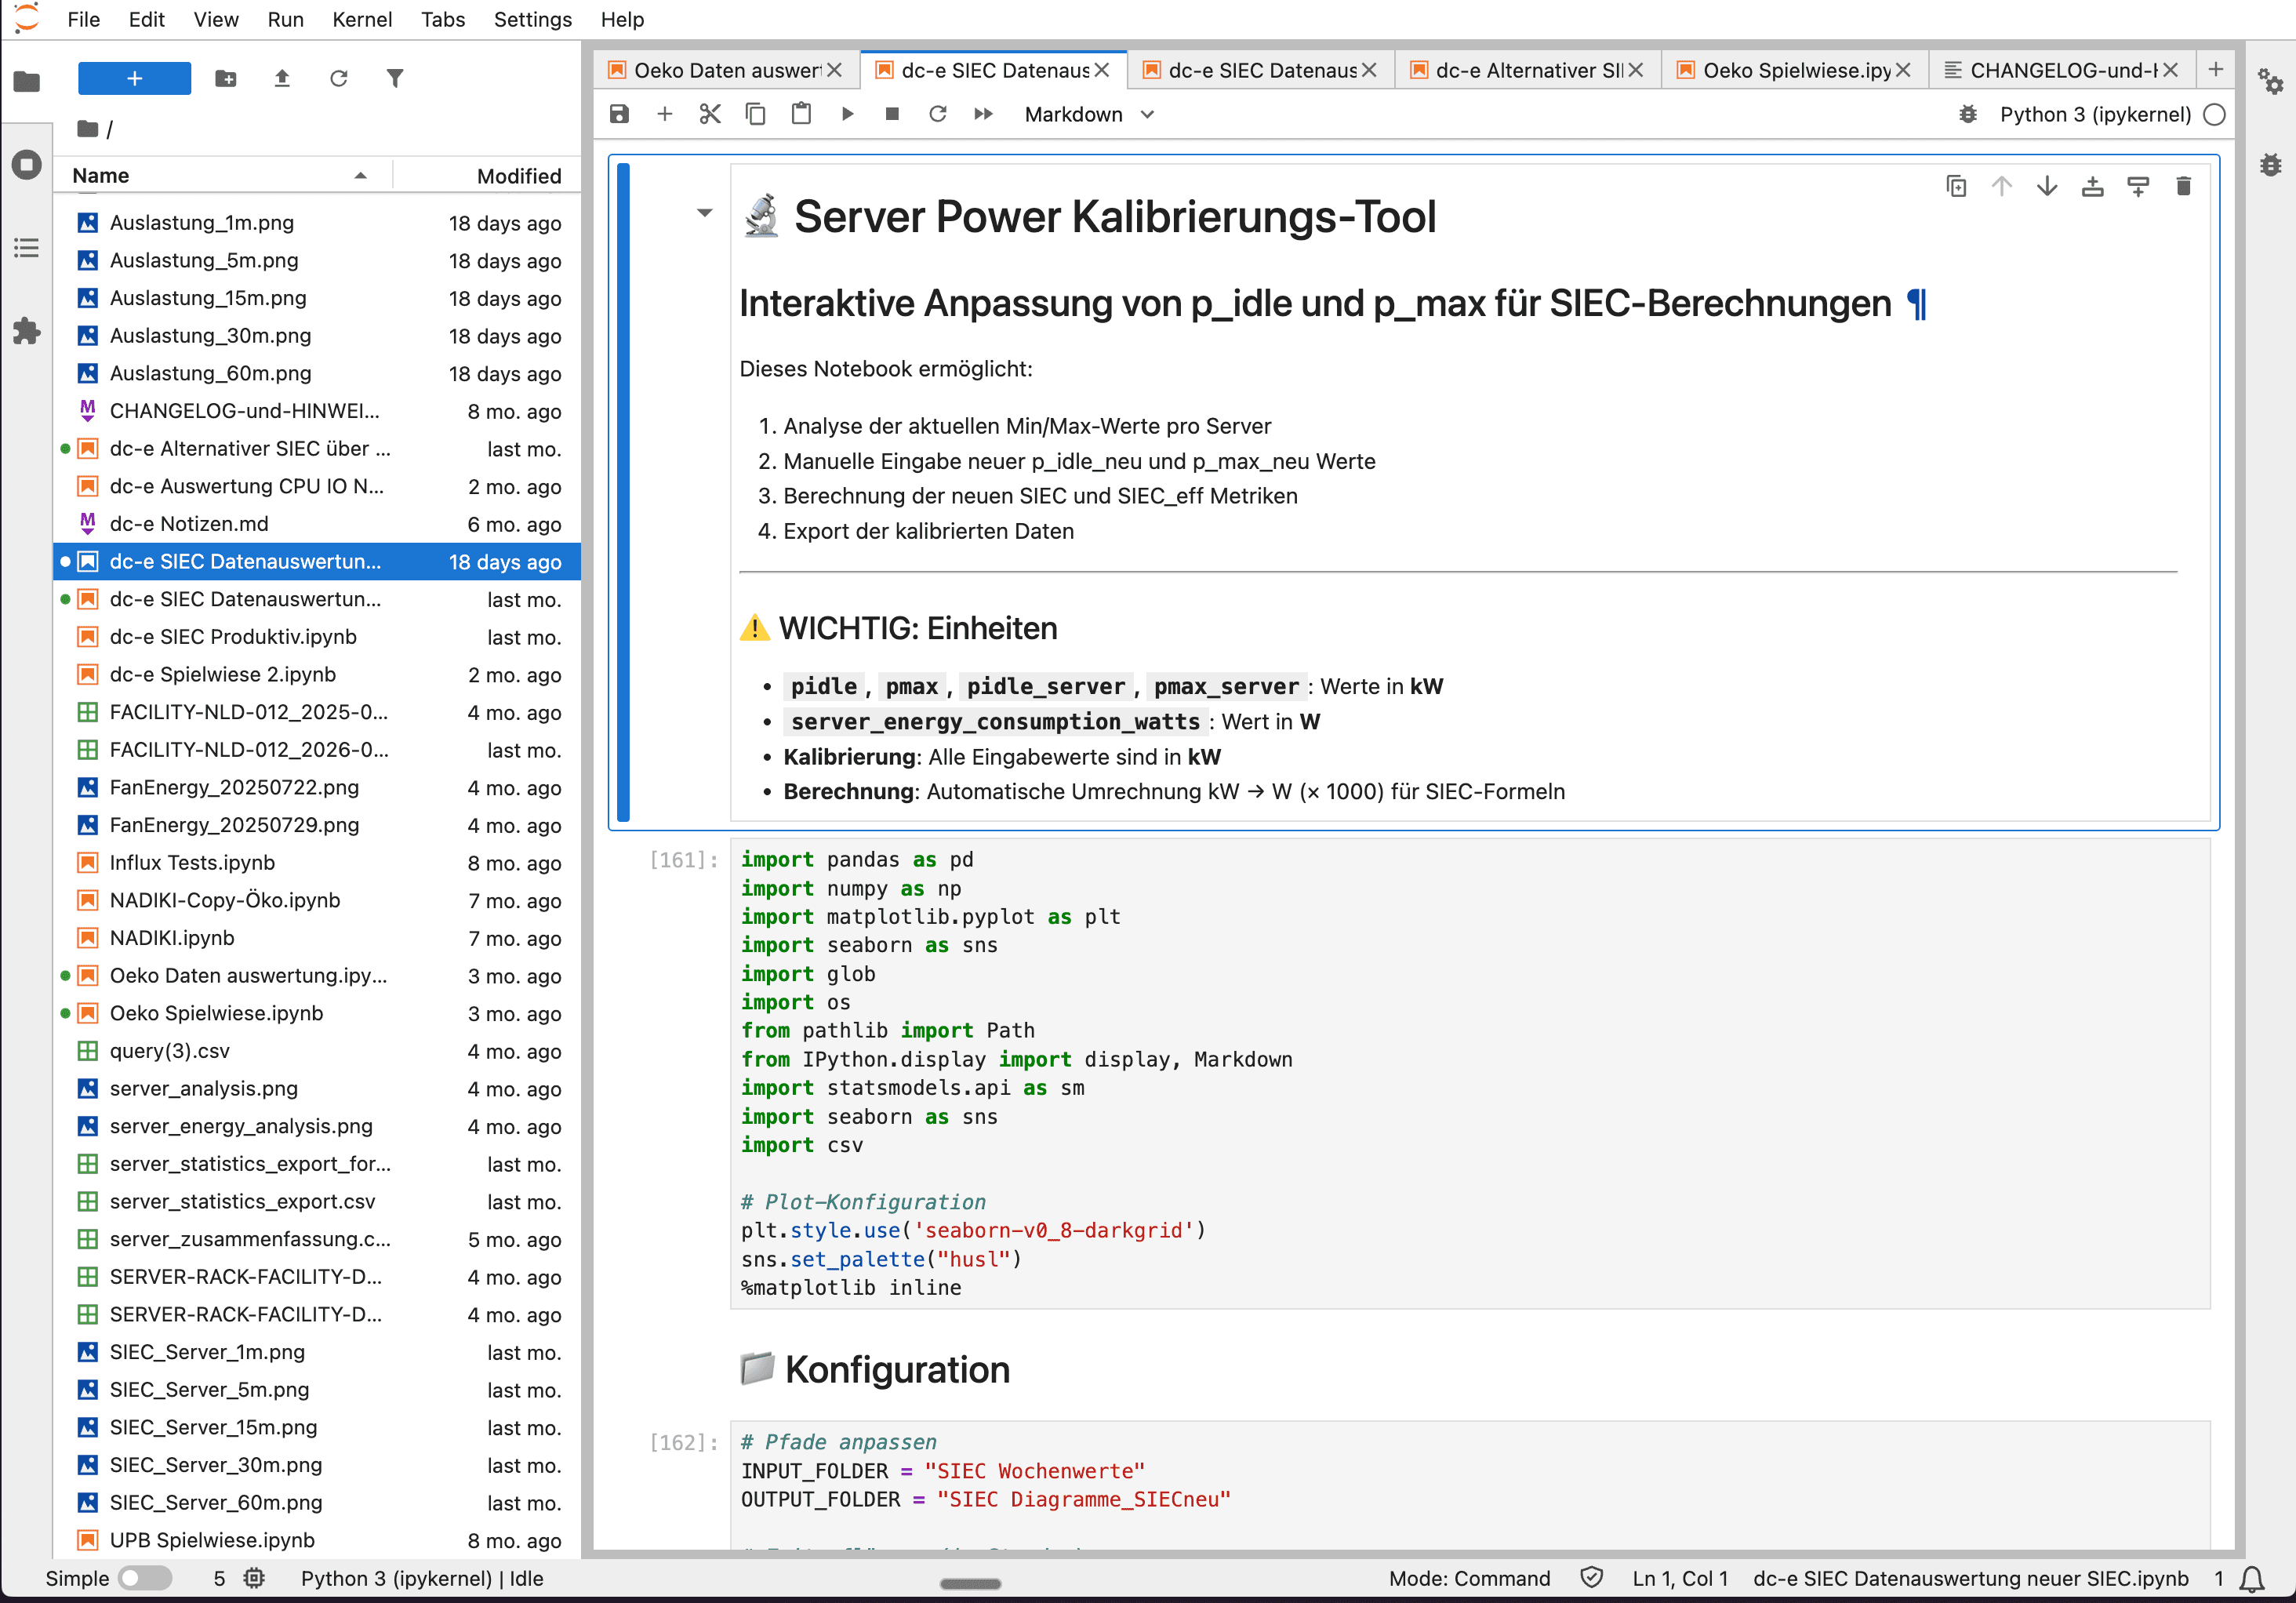
What is JupyterLab?
JupyterLab is a browser-based development environment for interactive data analysis. The core component is Jupyter Notebooks: documents that combine executable code (Python, R, Julia), visualizations, and explanatory text in one interface. Researchers write a query, execute it, and see the result immediately—as a table, chart, or statistical evaluation. This iterative workflow makes JupyterLab the standard tool in data research: hypotheses can be quickly tested, calculation models developed step-by-step, and results documented reproducibly.
In the NADIKI project, JupyterLab is directly connected to the databases of the Registrar system. Researchers access InfluxDB (time-series data such as power consumption and load) and indirectly access a MariaDB through the Registrar API (static system properties such as hardware configurations and location data)—without the need to operate their own infrastructure.
What data is available?
The research environment provides access to two categories of data from the connected pilot data centers:
Static system properties: Data center information such as PUE, area, UPS status, and diesel generator properties. On the server level: CPU models, GPU configurations, storage capacity, and RAM equipment. This data comes from the asset registration in the Observer system.
Dynamic metrics: Time series of power consumption, CPU load, cooling performance, network traffic, and read/write operations. This data continuously flows from the pilot data centers into the Registrar's InfluxDB.
All data is pseudonymized: locations, operators, and asset identifiers are anonymized, while measurement series and system properties remain fully intact.
> Source: IDED JupyterLab research environment
What researchers can do with it
The notebooks we provide show exemplary analyses—researchers can use them as a starting point and develop their own research questions:
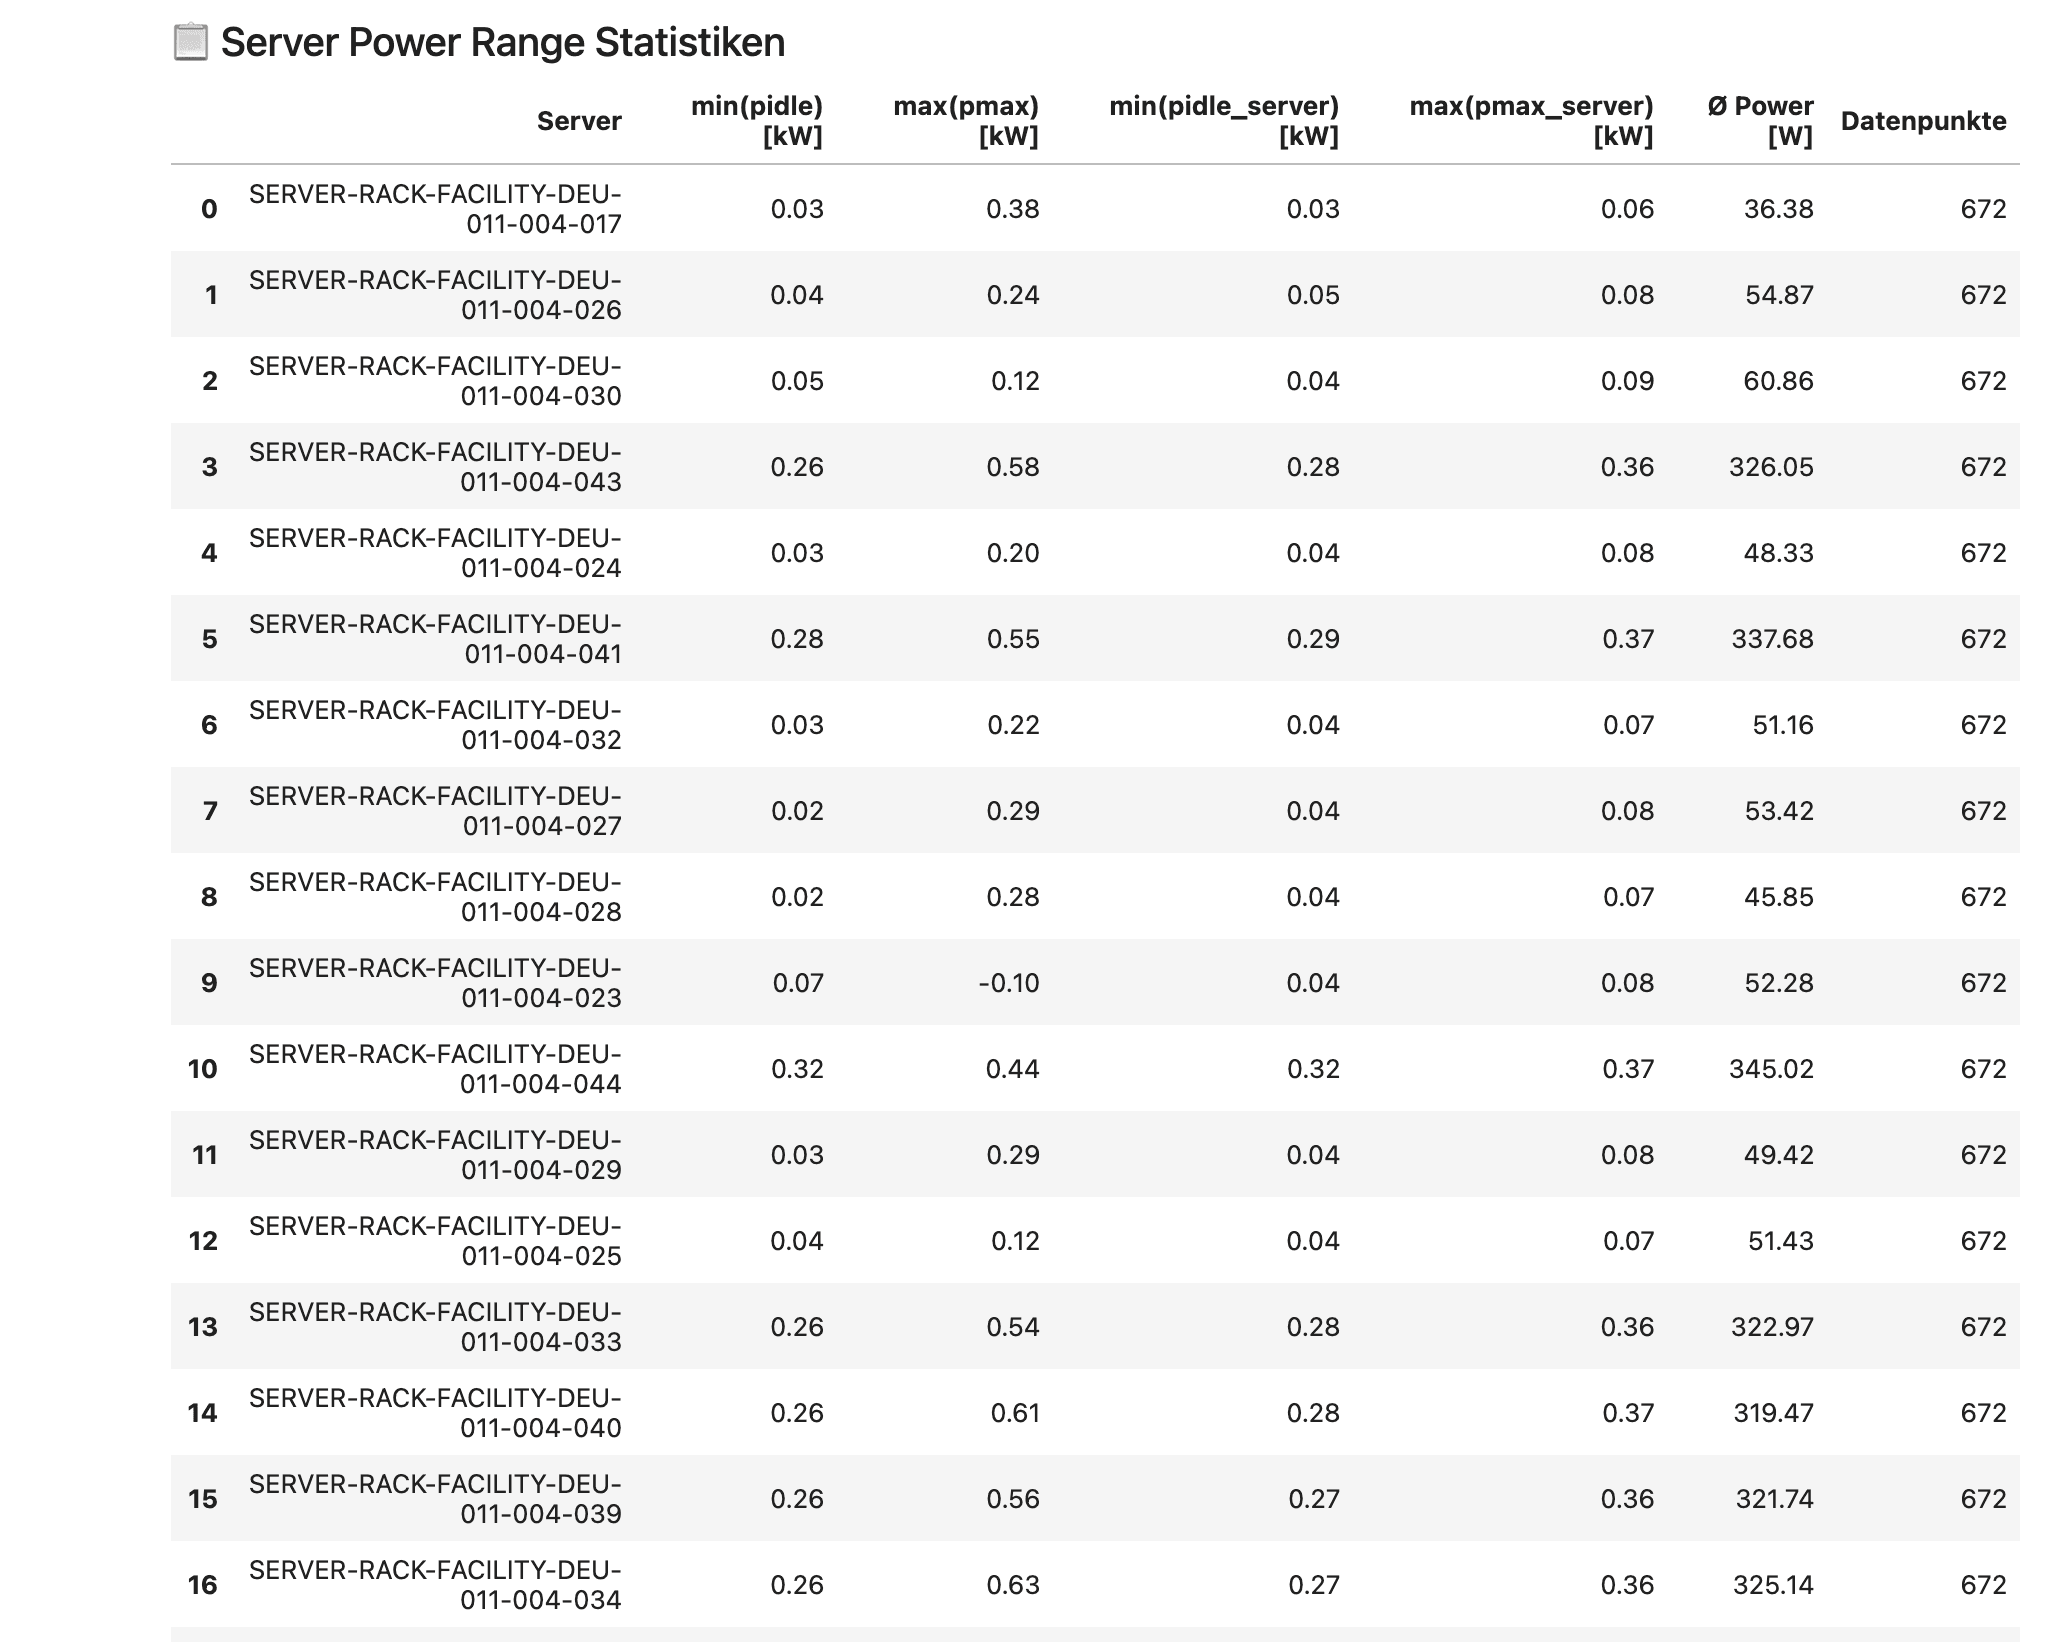
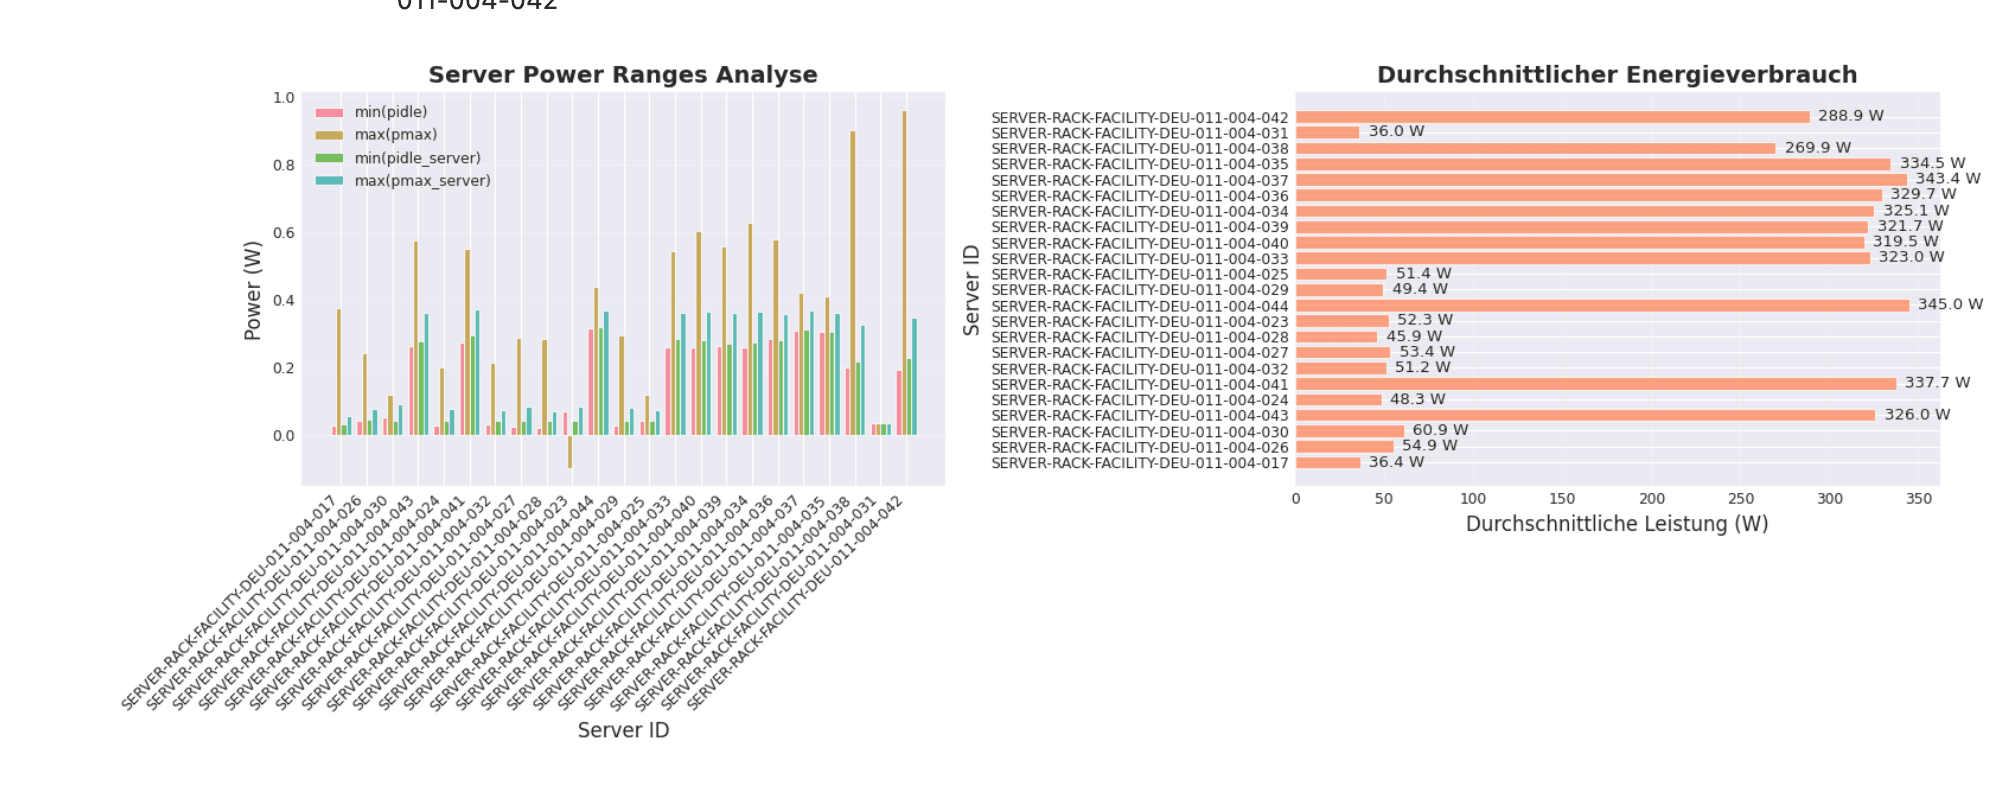
Energy consumption analysis: Evaluate the power consumption of individual servers over periods, identify idle consumption, and compare load profiles. The power range statistics show the minimum and maximum power consumption for each server in idle and load states.
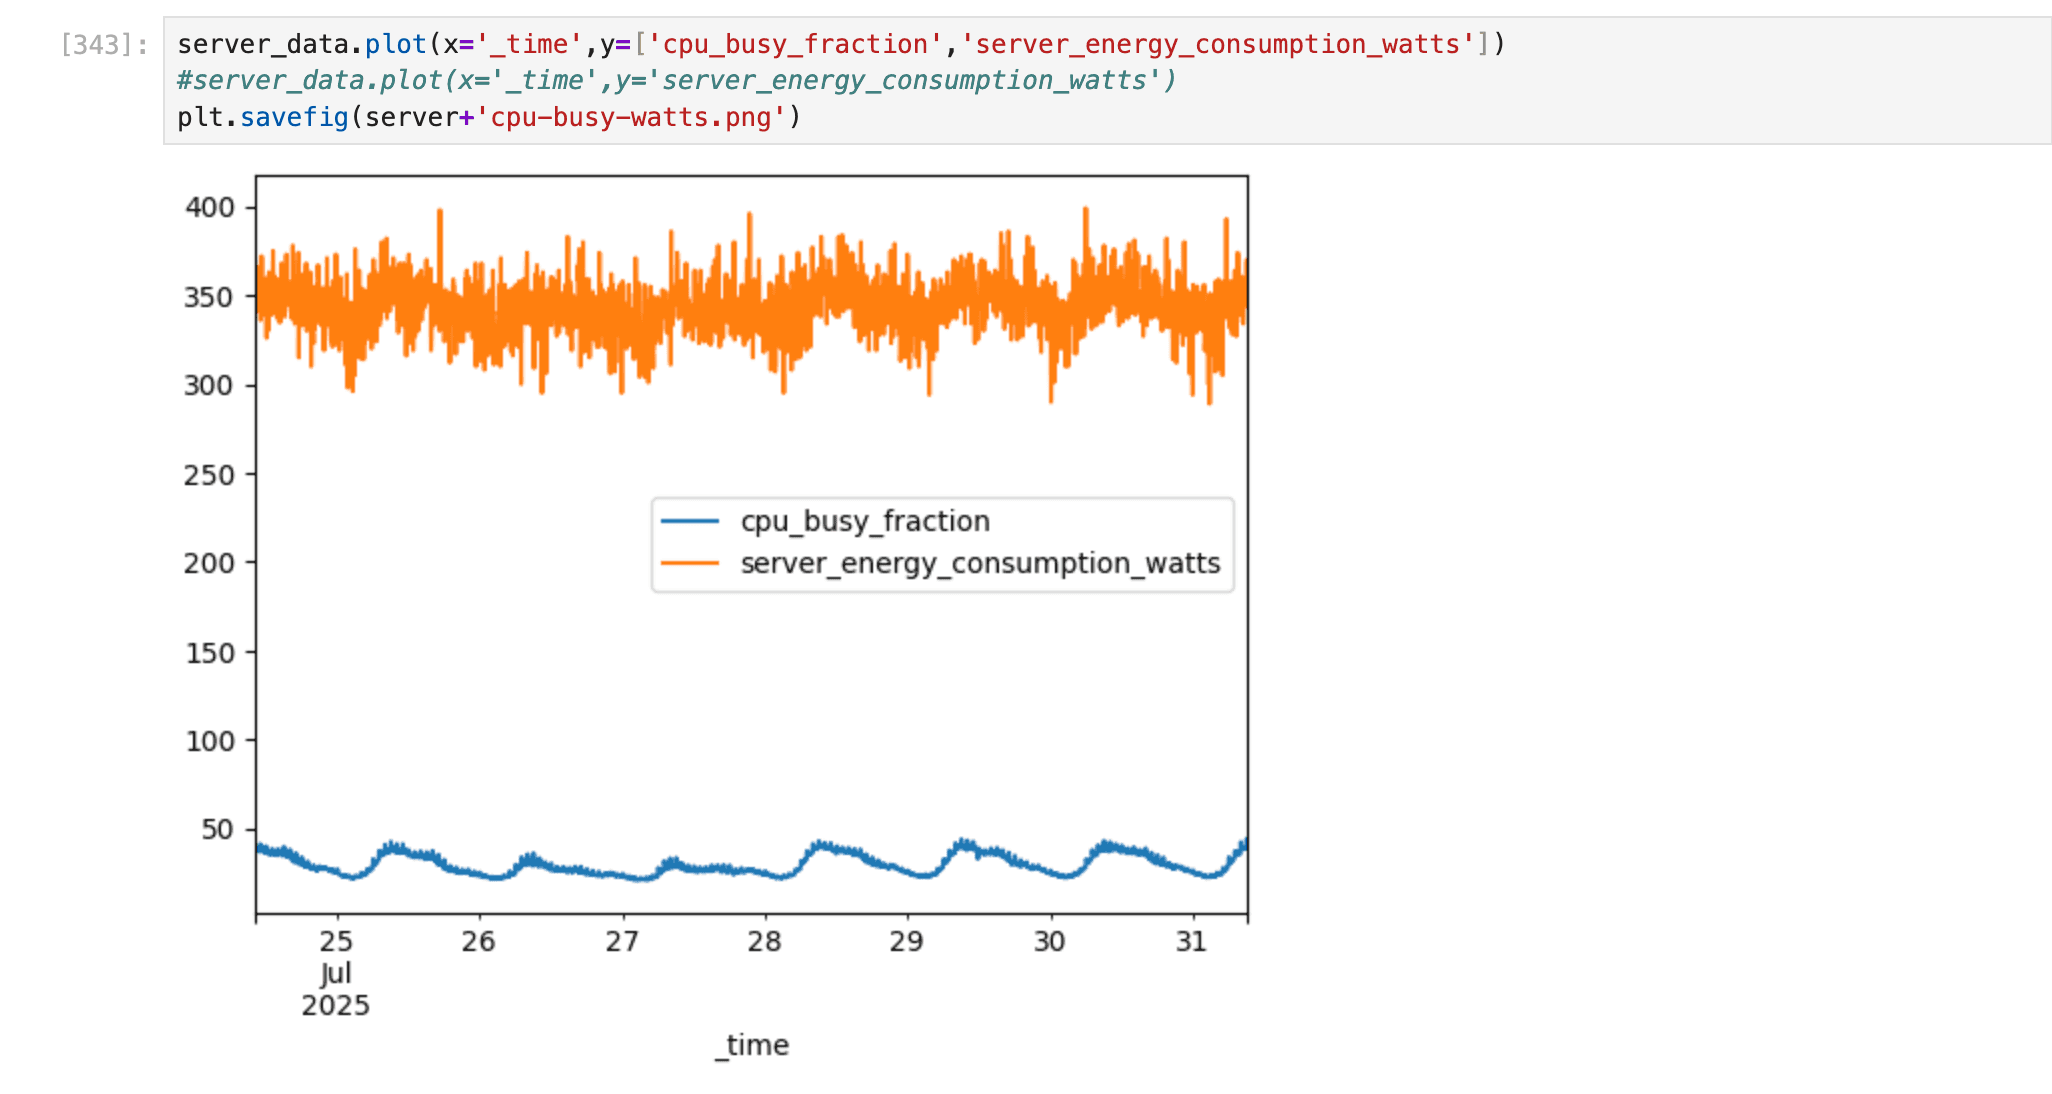
Efficiency correlations: Investigate the relationships between CPU usage and power consumption—for example, to analyze how load changes affect energy requirements.
Environmental impact models: Test new calculation models for environmental impact accounting—for example, alternative allocation methods or refined interpolation methods for missing measurements.
Calibration: Calibrate server power models using real measurement data to improve the accuracy of power consumption estimates.
> Source: IDED JupyterLab research environment
> Source: IDED JupyterLab research environment
Request access
Researchers can request access to the JupyterLab environment through the application form.